IT Support
Getting started with Microsoft Power BI
24 July 2026
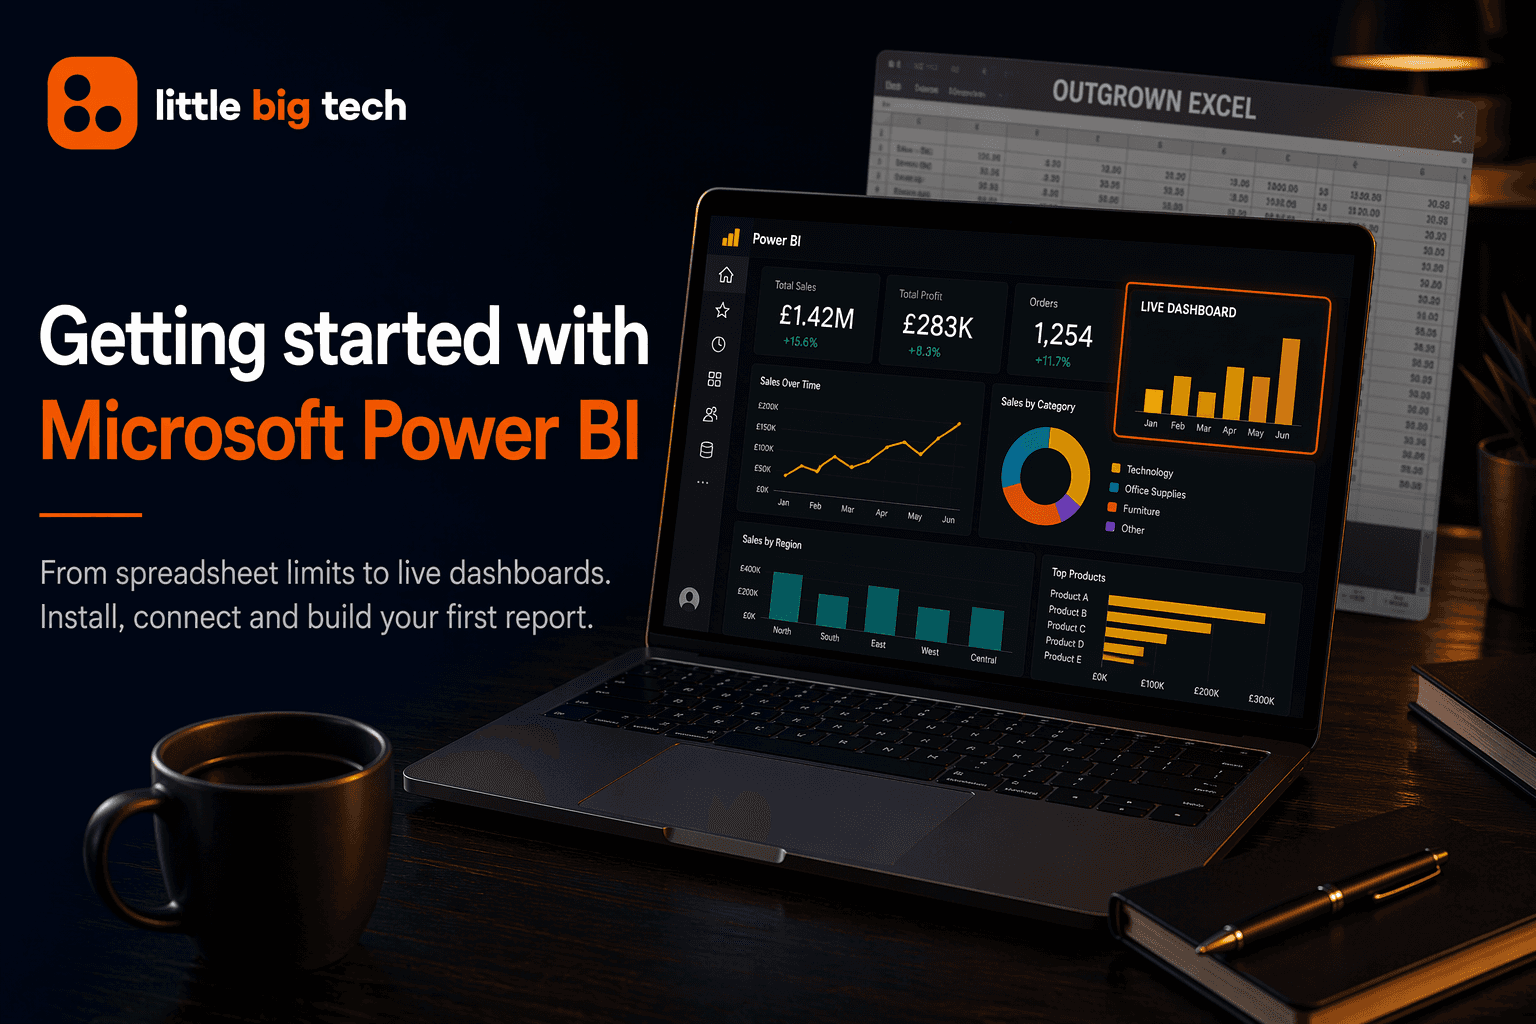
Most people first open Power BI because they've reached the limits of spreadsheets. Weekly reports take too long to update, data is spread across multiple systems, or someone needs answers quickly from a workbook that's grown far beyond what Excel was designed to handle.
Power BI brings all of that information together in one place. It connects to your data sources, turns raw information into interactive reports and dashboards, and can automatically refresh them as your data changes. In this guide, we'll explain what Power BI is, how it's structured, how to install Power BI Desktop, connect to your data, build your first report and answer some of the most common questions people ask when getting started.
What Is Power BI?
Power BI is Microsoft's business intelligence and data visualisation platform. It allows you to connect to your data, model it and turn it into interactive charts, dashboards and reports. Instead of scrolling through rows of numbers in a spreadsheet, you get a clear visual view of what's happening across your business.
It's part of the wider Microsoft Power Platform alongside Power Apps and Power Automate, and it's designed to work closely with Microsoft 365 applications including Excel, Teams, SharePoint and Azure.
What Is Power BI Used For?
Power BI is used across organisations of every size to analyse business data and make better decisions. Some of the most common uses include:
- Sales reporting
- Financial reporting
- Marketing performance analysis
- Operational dashboards
- Executive KPI reporting
- Inventory and stock management
- Customer and service reporting
Because Power BI connects directly to your data sources, reports update automatically whenever your data changes, reducing the need for manual reporting.
The Different Parts of Power BI
People often refer to "PowerBI" as though it's one application, but it's actually made up of several tools that work together.
Power BI Desktop
Power BI Desktop is the free Windows application where you'll spend most of your time. It's where you import data, clean it, create relationships between tables and build reports. If you're learning Power BI for the first time, this is where you'll start.
Power BI Service
Power BI Service is the cloud platform where reports are published, shared and viewed by other people across your organisation. It also manages scheduled data refreshes, dashboards and collaboration.
Power BI Mobile
Power BI Mobile allows you to access dashboards and reports from your phone or tablet, making it useful for people working remotely or away from their desk.
How to Download and Install Power Bi Desktop
Getting started with Power BI only takes a few minutes.
- Visit the official Microsoft Power BI Desktop download page.
- Select Download free. If required, you can choose a different language or version using the advanced download options.
- Run the installer and follow the on-screen instructions.
- Open Power BI Desktop and sign in using your Microsoft work or school account.
Power BI Desktop is free to download and use. You only need a paid Power BI licence when you want to publish and share reports through the Power BI Service, or if your organisation exceeds the free storage allowance. Many smaller organisations can comfortably use Power BI Desktop on its own while they're getting started.
Connecting to Your Data
One of Power BI's biggest strengths is its ability to combine information from multiple systems into a single report. Rather than analysing spreadsheets, databases and cloud applications separately, you can bring everything together into one dashboard.
Power BI supports hundreds of different data sources, including:
- Excel workbooks
- CSV files
- SQL Server
- SharePoint lists
- Microsoft Dynamics 365
- Salesforce
- Google Analytics
- Azure services
- Many other databases and cloud platforms
To connect your data:
- Select Get Data from the Home ribbon.
- Choose your data source.
- Select the tables or files you want to import.
- Review the preview window to confirm the data looks correct before loading it.
Cleaning and Modelling Your Data
Raw data is rarely ready to use immediately. Dates may be inconsistent, column headings might need renaming and unnecessary information often needs removing before reporting becomes useful.
Power BI's Power Query Editor allows you to clean and reshape your data. You can remove unnecessary columns, rename fields, correct data types, filter rows, merge tables and standardise values.
Every transformation you make is recorded as a step, so the next time fresh data is imported, Power BI automatically repeats those same cleaning steps without you having to start again.
Once your data is clean, move to Model view to create relationships between tables. For example, you might link a customer table to a sales table using a shared Customer ID. Getting these relationships right early makes building accurate reports much easier.
Building Your First Report
With your data connected and modelled, you're ready to build your first report.
- Open Report view.
- Drag fields onto the report canvas.
- Choose a visual such as a bar chart, line graph, table or KPI card.
- Use the Visualisations pane to customise formatting.
- Add slicers so users can filter data by date, region, department or product.
- Arrange your visuals into a dashboard that clearly tells the story behind the data.
It's tempting to include every chart available, but the best dashboards answer a handful of important questions clearly. If someone needs instructions to understand your report, it's usually a sign it could be simplified.
Learning DAX
As you become more confident with Power BI, you'll come across Data Analysis Expressions (DAX).
DAX is Power BI's formula language and is used to create reusable calculations across reports and dashboards. If you've worked with Excel formulas before, many of the concepts will feel familiar. You don't need to master DAX to build your first report, but learning the basics opens the door to much more powerful analysis.
Publishing and Sharing Reports
Once your report is ready, select Publish from the Home ribbon in Power BI Desktop.
Your report will be uploaded to the Power BI Service where you can:
- Share reports with colleagues
- Build dashboards
- Schedule automatic refreshes
- Control user permissions
- Access reports from anywhere
Sharing reports with other users generally requires a Power BI Pro or Premium licence, depending on how your organisation is licensed.
Common Mistakes When Getting Started
Importing too much data
It's tempting to load every spreadsheet and every table "just in case". In reality, importing only the data you actually need usually results in faster, simpler reports that are easier to maintain.
Ignoring data types
Dates stored as text or currencies imported as general numbers can quietly cause calculations to fail. Checking data types early saves a lot of troubleshooting later.
Building overly complicated dashboards
Adding more charts doesn't always make a report better. Focus on answering the questions your audience actually wants answered rather than displaying every available metric.
Avoiding DAX
Many people delay learning DAX because formulas seem intimidating. You don't need advanced calculations immediately, but understanding the basics makes Power BI significantly more powerful.
Common Questions When Getting Started
Is Power BI Desktop free?
Yes. Power BI Desktop can be downloaded and used free of charge. A paid licence is only required when sharing reports through the Power BI Service or exceeding the free storage allowance.
Do I need coding skills to use Power BI?
No. Power BI is designed for self-service analytics, so most reporting can be built using its visual, drag-and-drop interface. More advanced users can use DAX and Power Query's M language, but neither is required when you're starting out.
What's the difference between Power BI Desktop and Power BI Pro?
Power BI Desktop is the free application used to build reports. Power BI Pro is a paid licence that allows you to publish, share and collaborate on reports through the Power BI Service.
Can I use Power BI with Excel?
Yes. Power BI connects directly to Excel workbooks, and many of the concepts, including Power Query and data modelling, will already feel familiar if you've previously used Power Query or Power Pivot in Excel.
Getting the Most Out of Power BI
Power BI can seem intimidating at first, but most projects follow the same process: connect your data, clean it, model it, build your reports and share the results.
Start with one report and improve it over time. Many organisations begin with a single Excel workbook before expanding into SharePoint, SQL Server, Dynamics 365 and other business systems. Once you've built your first dashboard, it becomes much easier to see how Power BI can transform the way your organisation reports on data.
Is your business's technology environment resilient?
Find out how prepared you really are to keep operating and recover quickly if disruption hits — with a free Technology Resilience Score™.
Our services